Load and Analyze Data
The "Load File" section in ChemXploreML is the starting point for most workflows. It allows you to import your molecular data, preprocess it, and perform an initial analysis to understand its characteristics. This feature is divided into two main tabs: Load Data and Analyse Data.
Load Data Tab
This tab is for loading your dataset and configuring how it should be read and processed.
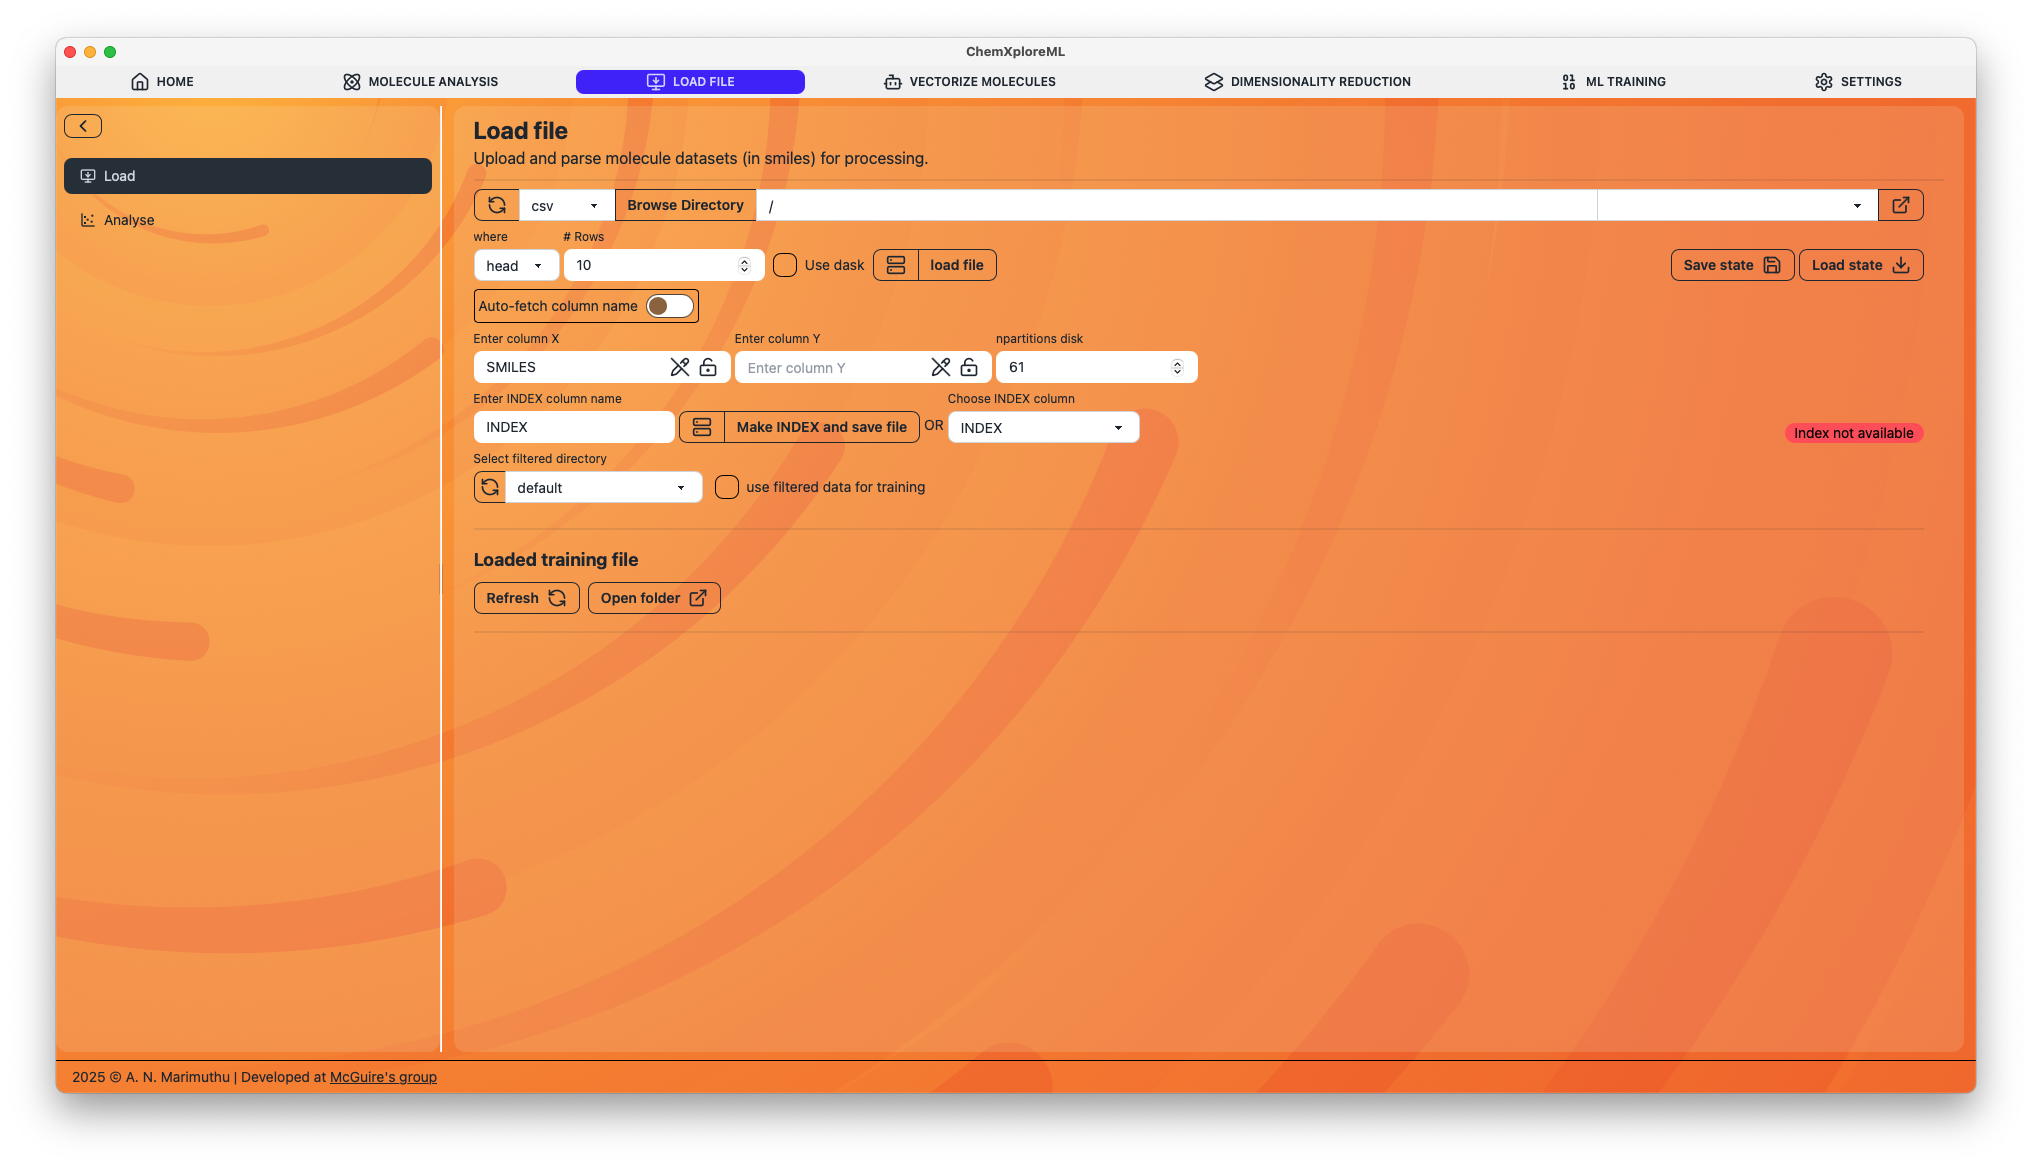
1. File Selection
- Browse File: Click this to open a file dialog and select your dataset. The application supports common formats like CSV and SDF.
- Use Dask: Enable this option if you are working with a large dataset that doesn't fit into memory. Dask will process the data in chunks.
2. Column Configuration
Once a file is loaded, you need to specify the key columns:
- Column X: Select the column containing the molecular representations, typically SMILES strings.
- Column Y: Select the column containing the target property you want to predict (e.g., bioactivity, solubility).
- Index Column: Specify a column to be used as a unique identifier for each molecule. If you don't have one, you can create it.
3. Indexing and Saving
- Make INDEX and save file: If your dataset lacks a unique index column, you can create one here. This will save a new version of your file with an added index column.
4. State Management
- Save State: Saves the current configuration (file path, column selections, etc.) to a JSON file. This is useful for saving your work and ensuring reproducibility.
- Load State: Loads a previously saved configuration file.
Analyse Data Tab
After configuring your dataset in the "Load Data" tab, switch to the "Analyse Data" tab to perform a detailed analysis.
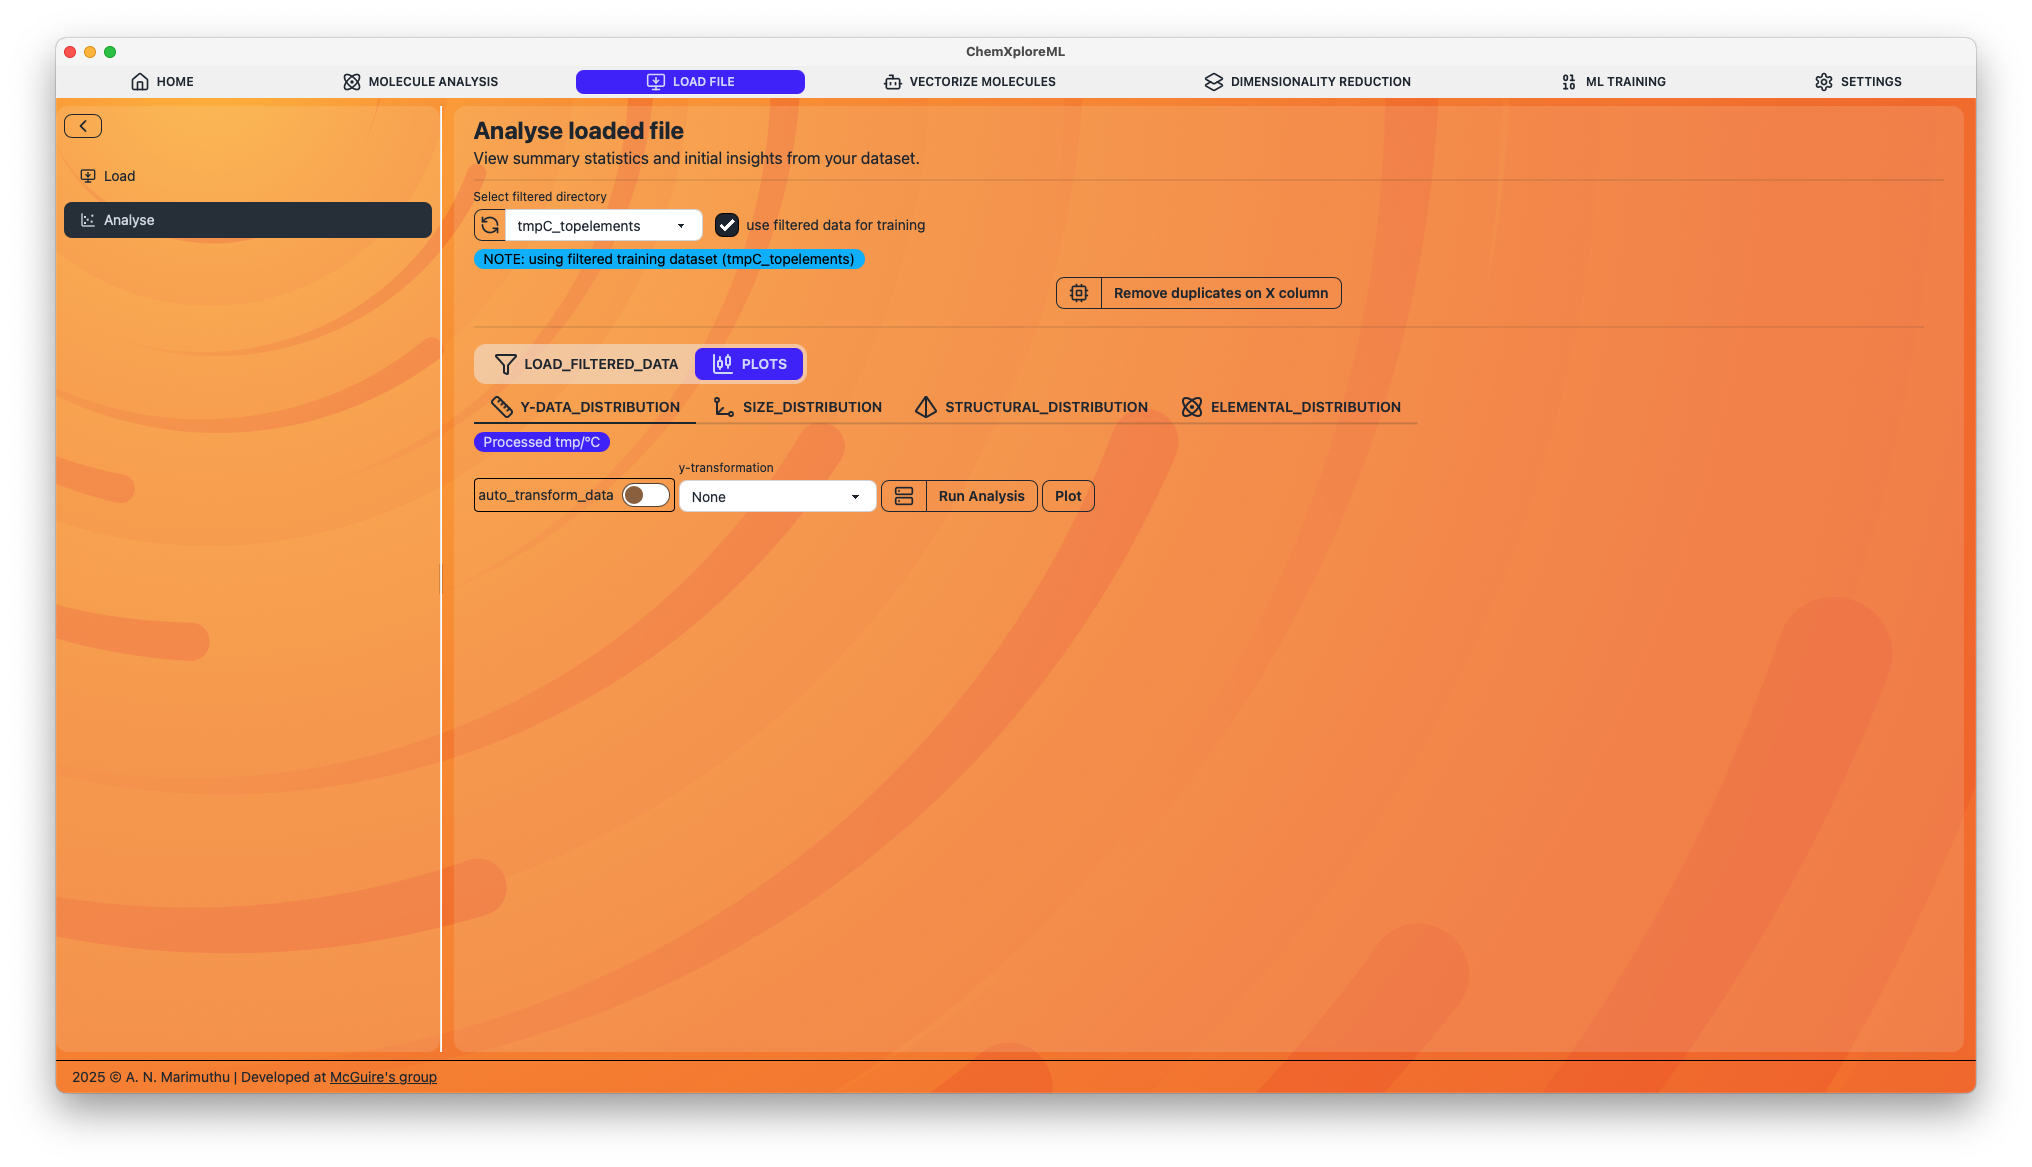
1. Duplicate Removal
- Remove duplicates on X column: This function checks for and removes any duplicate entries based on the SMILES column (Column X). It will create a new, deduplicated file for you to use in subsequent steps.
2. Data Visualization and Filtering
The application generates a series of plots to help you visualize the distribution of various molecular properties in your dataset.
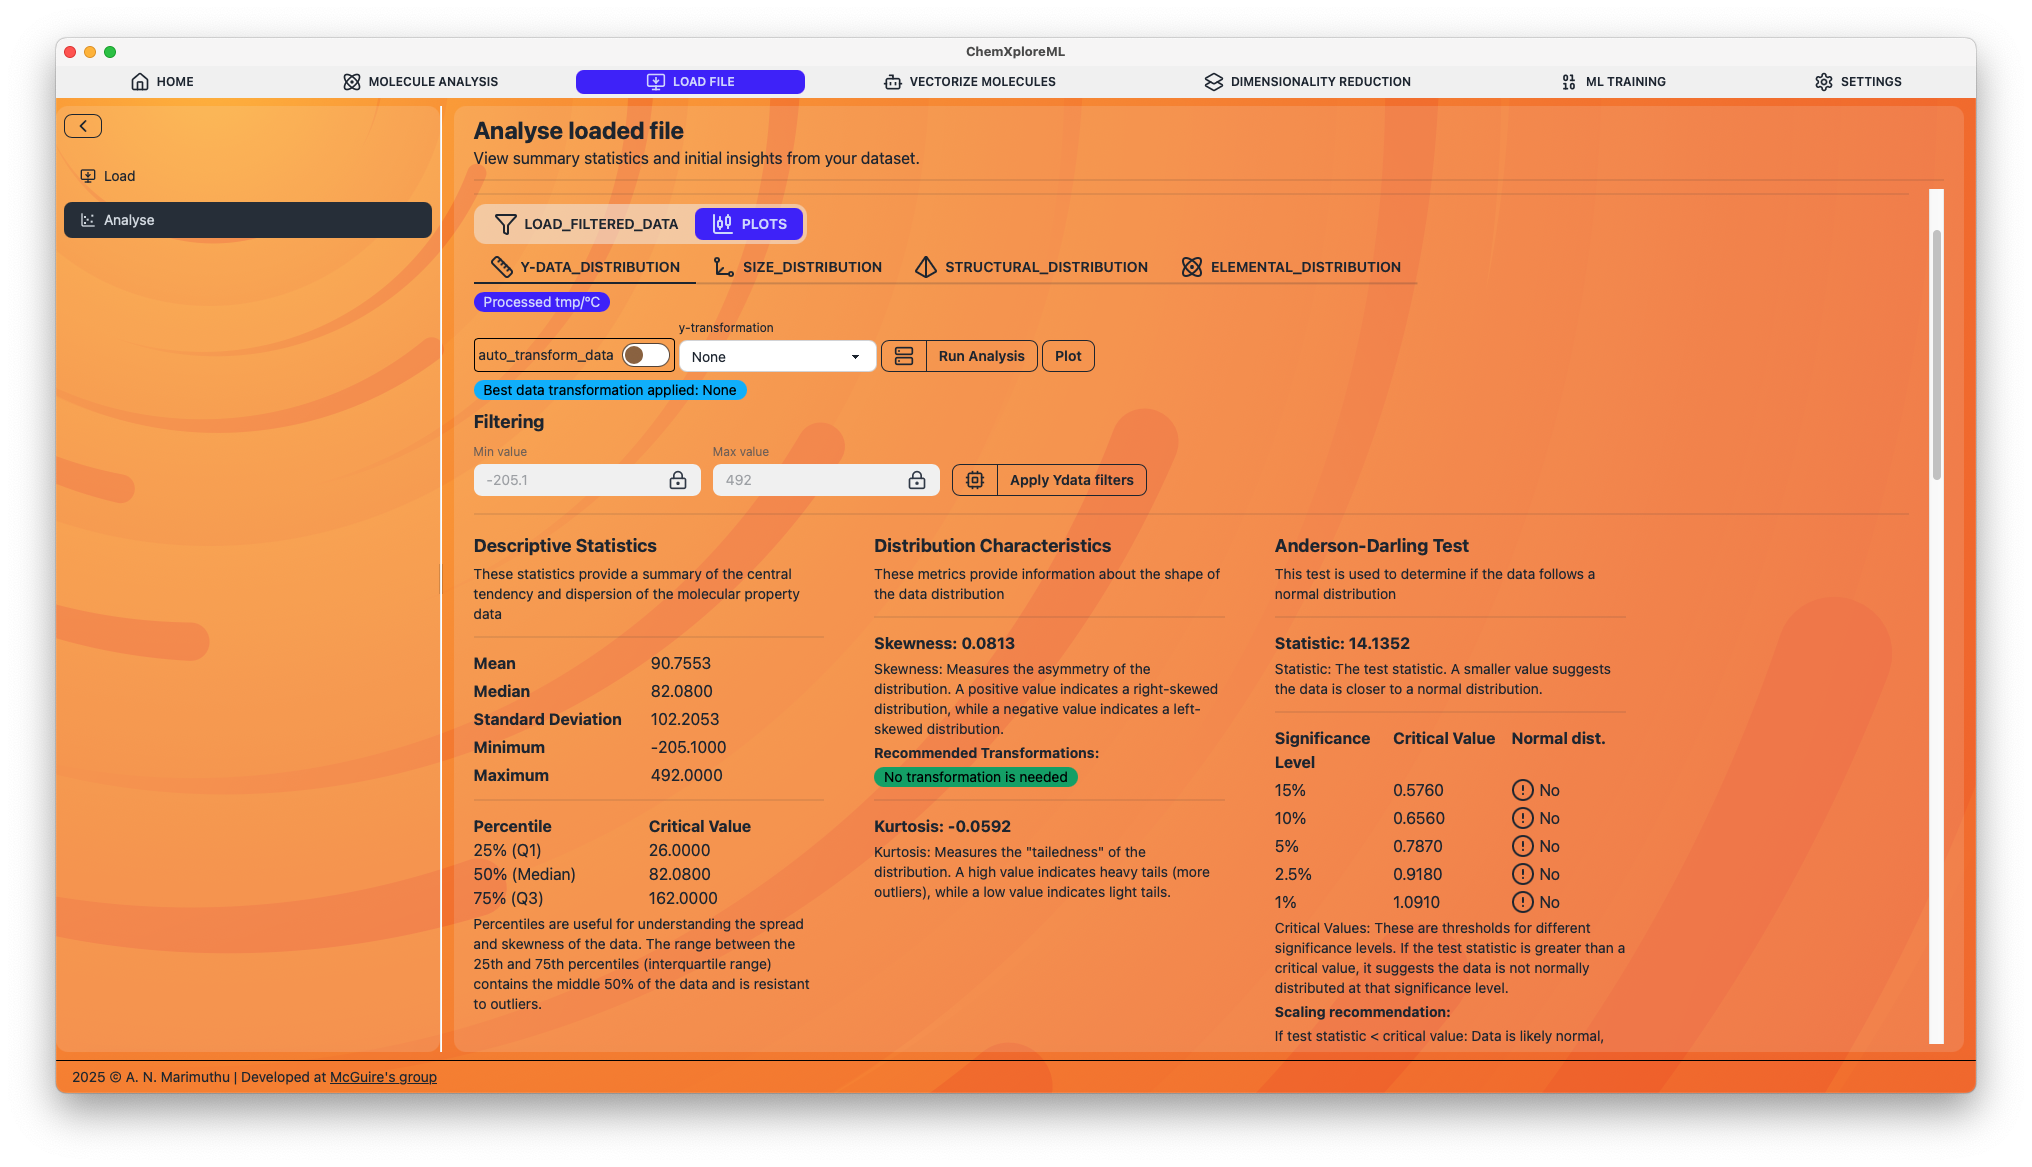
For each plot, you can apply filters to select a subset of your data. For example, you can filter molecules based on the number of atoms, the presence of certain elements, or specific structural features.
- Apply Filters: Once you have defined your filters, you can apply them to create a new, filtered dataset. This is a powerful way to refine your dataset for model training.
Next Steps
After loading, analyzing, and filtering your data, you are ready to proceed with the core machine learning tasks: